By age
BMI chart by age
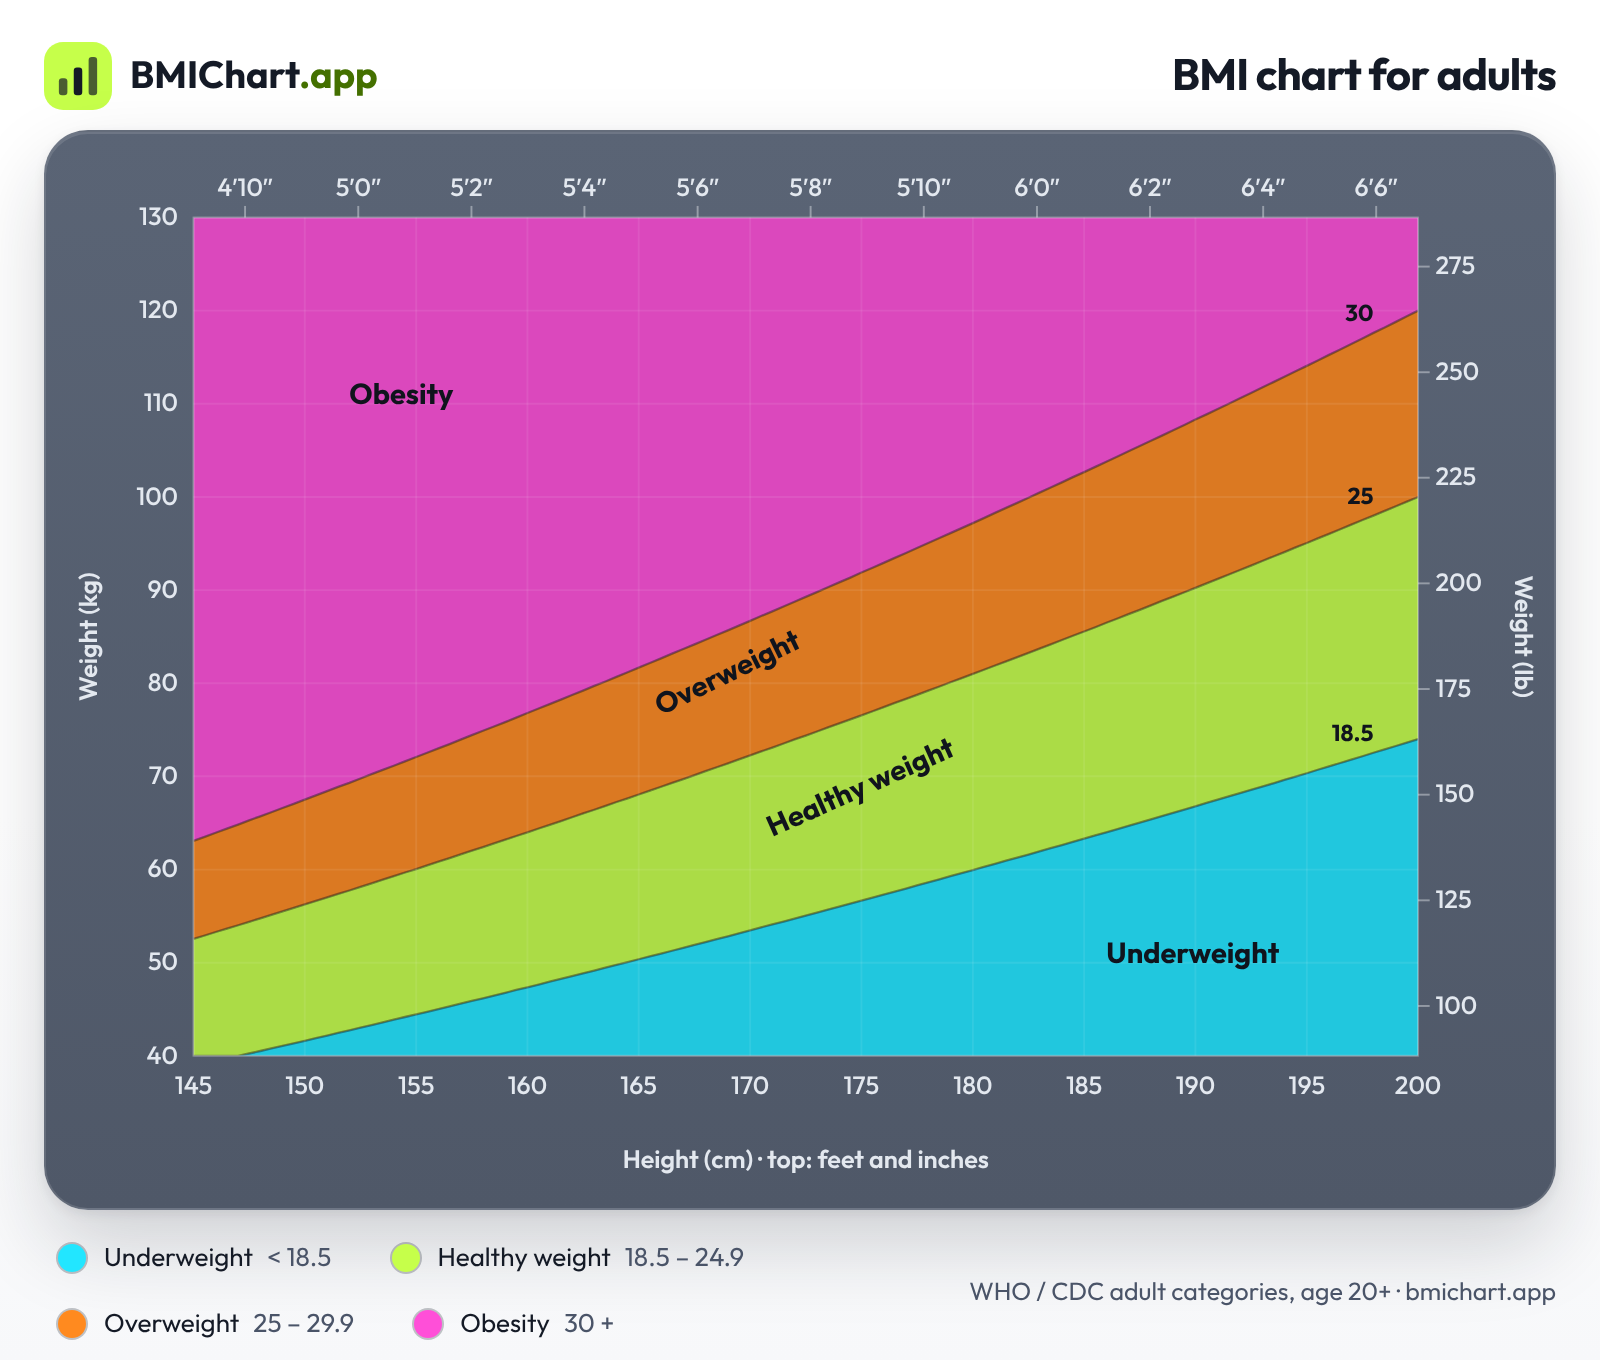
The honest answer: adults aged 20 and over use the same BMI cut-offs at every age, for women and men alike. Children and teens are different. They are compared with other children of the same age and sex using CDC percentiles.
Adults 20 and over: one set of cut-offs
| Age | Underweight | Healthy weight | Overweight | Obesity |
|---|---|---|---|---|
| 20 – 29 | Under 18.5 | 18.5 – 24.9 | 25 – 29.9 | 30 + |
| 30 – 39 | Under 18.5 | 18.5 – 24.9 | 25 – 29.9 | 30 + |
| 40 – 49 | Under 18.5 | 18.5 – 24.9 | 25 – 29.9 | 30 + |
| 50 – 59 | Under 18.5 | 18.5 – 24.9 | 25 – 29.9 | 30 + |
| 60 – 69 | Under 18.5 | 18.5 – 24.9 | 25 – 29.9 | 30 + |
| 70 + | Under 18.5 | 18.5 – 24.9 | 25 – 29.9 | 30 + |
If you have seen a “BMI chart for women by age” with a different ideal number for every decade, it is not based on the official categories. The CDC and WHO use one adult scale. What does change with age is body composition: most people slowly lose muscle and gain fat, so the same BMI can mean more body fat at 60 than at 25. To find your weight range, use the BMI chart by height and weight.
Children and teens (2 to 19): percentiles
BMI is calculated the same way for children, but the number is then placed on a growth chart for the child's age and sex. The result is a percentile: a BMI at the 60th percentile is higher than 60% of children of the same age and sex in the CDC reference data.
| BMI-for-age percentile | CDC category |
|---|---|
| Under the 5th | Underweight |
| 5th to under 85th | Healthy weight |
| 85th to under 95th | Overweight |
| 95th or above | Obesity |
| Severe obesity | 120% of the 95th percentile or more, or a BMI of 35 or more |
Our calculator shows the BMI number for anyone under 20 but deliberately does not guess a percentile or an adult category. Read why under-20s are treated differently, or use the CDC Child and Teen BMI Calculator.
Older adults
The adult categories still apply after 65, but studies suggest a slightly higher BMI may be fine and that a BMI under 23 deserves attention. Details and sources: BMI chart for seniors and women over 60.
Questions
Is there a BMI chart for women by age?
Not for adults. From age 20, the same BMI categories apply to women at every age: under 18.5 underweight, 18.5 to 24.9 healthy weight, 25 to 29.9 overweight and 30 or more obesity. Charts that show different “ideal” BMIs for each decade are not official CDC or WHO categories.
Is there a BMI chart for men by age?
No. Men aged 20 and over share the same adult categories at every age, and they are the same as for women.
How is BMI judged for children and teens?
For ages 2 to 19, the CDC compares a child’s BMI with other children of the same age and sex. Under the 5th percentile is underweight, 5th to under 85th healthy weight, 85th to under 95th overweight and 95th or above obesity.
Does a healthy BMI change after 65?
The official categories do not, but research on older adults suggests a slightly higher BMI may be fine and a BMI under 23 deserves attention. See our BMI chart for seniors.
Sources
- CDC: Adult BMI categories.
- CDC: Child and Teen BMI categories.
- CDC: Growth charts.
- WHO: Obesity and overweight fact sheet.
Last reviewed: 2026-10-06. Checked against the sources listed on this page.
BMI is a screening estimate, not a diagnosis and not medical advice. It does not measure body fat directly. For health questions, talk to a doctor or nurse.